
Overview of the Direct-to-Consumer (DTC) Sector – 2022
You are reading Part 2 of a series of 2 parts. Click here to be directed to Part 1
Delivery Timelines
One of the most noteworthy shifts in the Direct-To-Consumer (DTC) sector recently has been the modification of delivery durations.
Much of this change is attributable to Amazon's grip on the ecommerce industry.
Amazon's policies of free shipping and next-day or same-day delivery have reshaped customer expectations around delivery charges and timescales. Consequently, other ecommerce businesses have had to revisit their fulfilment practices and delivery strategies. Despite the augmented costs, rapid delivery is now a prerequisite for brands aiming to enhance customer loyalty and long-term value. It has been noted that customers are more likely to remain loyal to brands that provide free delivery and next-day or two-day shipping options, whereas brands lacking such policies witness a significant drop in conversion rates.
Same-day delivery across the US isn't always feasible, especially for DTC brands that lack a network of warehouses nationwide. Free returns and refunds further decrease profit margins. Geographical spread, the consequent reduction of urban density, and the expectation of free and quick returns will drain operational cash from DTC registers. On the procurement side, the supply chain crisis shows no signs of abating. Increasing advertising expenses on one side and debilitating logistics and supply chain costs on the other could slow down the momentum of the DTC sector, with acquisition and delivery expenses being major hindrances.
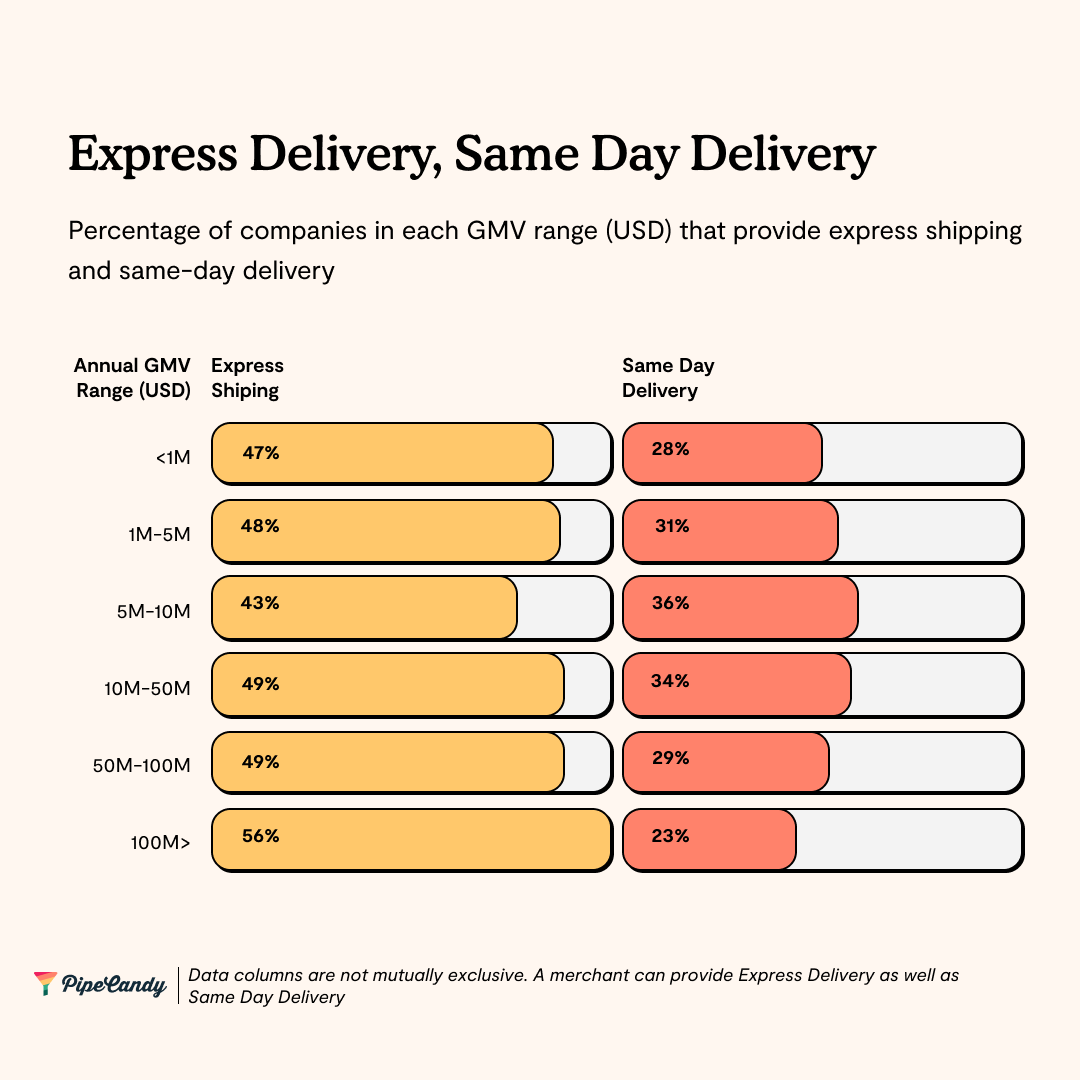
Delivery Times by Business Scale
In 2019, roughly 26% of small and medium-sized businesses (SMBs) provided next-day delivery. PipeCandy's research suggests this figure has now risen to 41%.

The larger the enterprise, the more likely they are to offer speedy shipping options.
According to PipeCandy's research, at least 25% of all DTC businesses provide next-day and two-day delivery, and this figure increases to 30% for mid-market brands. Frequently, brands focused on groceries collaborate with on-demand delivery platforms like Instacart or DoorDash for their same-day or next-day delivery needs.
DTC and Shipping Providers
The three primary shipping providers used by DTC brands in the US are FedEx, UPS, and the United States Postal Service (USPS).
E-commerce logistics is the least profitable of all the segments a carrier can work in due to the small size of most parcels and the various uncertainties, such as incorrect addresses, returns, fluctuations in demand, and so forth. Additionally, most shipping providers are regional and are limited by physical space, availability of management staff, and high staff turnover.

According to PipeCandy’s analysis, the United States Postal Service (USPS) has the biggest market share in the SMB segment. USPS remains the linchpin for SMB product logistics. USPS has also been maintaining an on-time performance superior to private carriers and is likely to continue this trend.
For the mid-market and large enterprise segments, UPS has the largest market share.
Only about 27% of UPS' revenues are generated from its SMB customers and it is securely positioned in the enterprise segment with strong relationships with major brands. Among these, Amazon is its biggest customer, contributing 13% of its annual revenues. However, UPS's largest customer is also its biggest threat. Amazon is quickly becoming a competitor, having already surpassed FedEx in shipping volume and attracting more SMB brands to its seller program.
Google Ads Expenditure by DTC Businesses
Currently, around 68% of online experiences begin with a search on a search engine, and 85% of shoppers conduct some form of online research before purchasing online. Google, with its billions of daily searches and 3 billion Android devices globally, is the most crucial discovery platform for any product or brand, with Amazon as its only rival.
PipeCandy's data shows that more than 60% of DTC companies did not spend on Google Ads in the last year. Among the businesses that do spend on Google Ads, over 80% spend less than USD 5,000 per month, and 76% of these receive fewer than 500,000 visitors per month.
About 7% of mid-market businesses spend between USD 10,000 to USD 50,000 per month on Ads.

The Connection Between Physical Stores and Google Ads Expenditure

Enterprise businesses with DTC channels dominate Google Ads, spending 6 to 8 times the budgets of mid-market brands and many times over that of the long-tail ecommerce businesses. Within this group, businesses with physical stores spend roughly 1.8 times more on Google Ads than large digital native brands. These are primarily retailers with many multiple SKUs. Meanwhile, the difference in budgets between brands with physical stores and those with a digital-only presence in the mid-market and long-tail segment is not too pronounced.

The average monthly Google Ads spend is significantly higher for purely B2C businesses than those operating both B2B and B2C channels. Fashion and Apparel brands make up almost 68% of the latter and have a strong distribution network apart from their stores and online channels.
Fashion and Apparel businesses dominate the DTC sector, both in terms of brand numbers and the number of SMBs with less than USD 5M in Gross Merchandise Value (GMV) or the "long tail".

Direct-to-consumer (DTC) enterprises focusing on Fashion and Apparel constitute approximately 60% of all DTC businesses. However, they only make up 37% of the expenditure on Google Ads, with an average monthly budget of roughly USD 5,400.
By contrast, Home and Garden enterprises typically spend about USD 22,000 per month on Google Ads, while Consumer Electronics and Appliances businesses spend approximately USD 15,000 monthly.
DTC Brands Transitioning to Physical Stores
The traditional DTC model aimed to sell a limited range of products via select direct channels and scale quickly upon customer acquisition. But over the past few years, the rising costs of acquiring customers and online data privacy uncertainties have challenged this approach. Therefore, more and more DTC brands are opening physical stores.
Several previously online-only DTC brands have adopted an omnichannel approach, with some experimenting with one or two physical locations, others distributing via traditional retailers, or brick-and-mortar boutiques incorporating an online presence to increase their customer base.
Physical Stores among Small to Medium-sized DTC Brands
PipeCandy estimates suggest that about 47% of small to mid-sized DTC enterprises have physical outlets, either standalone shops or sections within larger retail stores.
This trend is especially prevalent in the Fashion and Apparel sector, where 55% of enterprises have a direct or indirect physical presence.

Interestingly, the Home and Garden sector shows a different trend regarding physical stores.
While this category traditionally depends on brick-and-mortar shops, there are more home décor and furnishings brands within the long tail of DTC ecommerce without a physical outlet than those with physical stores. However, businesses dealing with Home Decor and Furnishings see a rise in physical outlets as the business size grows.

The Food & Beverage sector is still relatively new to the digital sphere. Despite a high customer loyalty for food brands, this sector has long relied on grocery retailers to sell their products. Most brands in this industry lack the necessary infrastructure to collect customer data and use that data to gain actionable insights. While a DTC model in conjunction with a physical store might help launch a brand, budding food brands still rely on traditional distribution channels to scale.
Social Media and DTC Brands
While social media presence isn't necessarily a reliable measure of a brand's customer engagement, analysing social media listings can highlight the most prominent "brands" among businesses. Most modern businesses have social media accounts, with DTC brands maintaining a strong presence on social media, often posting frequently with well-thought-out messages.
At PipeCandy, we analysed the social media presence of 10,797 DTC businesses across the top 10 product sub-categories on platforms like Facebook, Instagram, Twitter, Pinterest, and YouTube.
Now, social media has moved beyond simple advertising, with many platforms incorporating native ecommerce features to merge advertising and transactions. Different social media platforms have unique characters and reach, prompting many brands to maintain a presence on multiple platforms.
The more platforms a brand utilises, the more diversified its engagement becomes, as each platform enables different content formats and reaches a unique set of audiences with varying engagement patterns.
Around 75% of the brands we analysed have an account on at least three or more platforms, while at least 44% have four or more accounts.

Typically, the type of business dictates the number or choice of social platforms they invest in. For example, social media's fascination with pets means that pet product brands need to be active across various platforms. Approximately 23% of brands in the Pets and Pet Care sector are on no less than five social media platforms. Similarly, the importance of product demonstrations and usage-related content means that brands in the Consumer Electronics and Appliances sector invest in social platforms like YouTube. At least 85% of businesses in this category are on three or more social channels, with at least 50% having four or more.
The Continued Importance of Websites Despite Social Media
Social media presence partially aims to drive conversions, regardless of where these conversions ultimately occur. This includes using social proof (content or comments generated by customers or the target audience that endorses the brand).
The smartphone is a crucial point of contact for DTC companies, both for purchases and social connections. According to a study by LiveIntent, the advertising click-through rate for DTC brands is three times higher on mobile than on desktop. However, the work-from-home trend, spurred by the pandemic, means that shoppers discover and transact on websites even during work hours, emphasising the continuing importance of desktop websites for brand discovery and engagement.

The average monthly visitor count is highest amongst Consumer Electronics and Accessories within the small tail of DTC. In the mid-market, Entertainment, Art and Merchandise attract the most visitors each month. The Consumer Electronics and Accessories segment also has the highest average visits per visitor, which is likely due to the feature-rich products, frequent upgrades, and the necessity of websites for product searches and price comparisons.
The Prevalence of Facebook and Instagram
Facebook and Instagram are the most popular social media platforms, with more than 90% of social media-present brands maintaining accounts on these platforms. Twitter comes in third, with 60% of DTC brands having a Twitter handle.
PipeCandy's data reveals that among businesses with only one social media account, 63% of them use Instagram. And for those with two accounts, at least 88% of them utilise Facebook and Instagram.

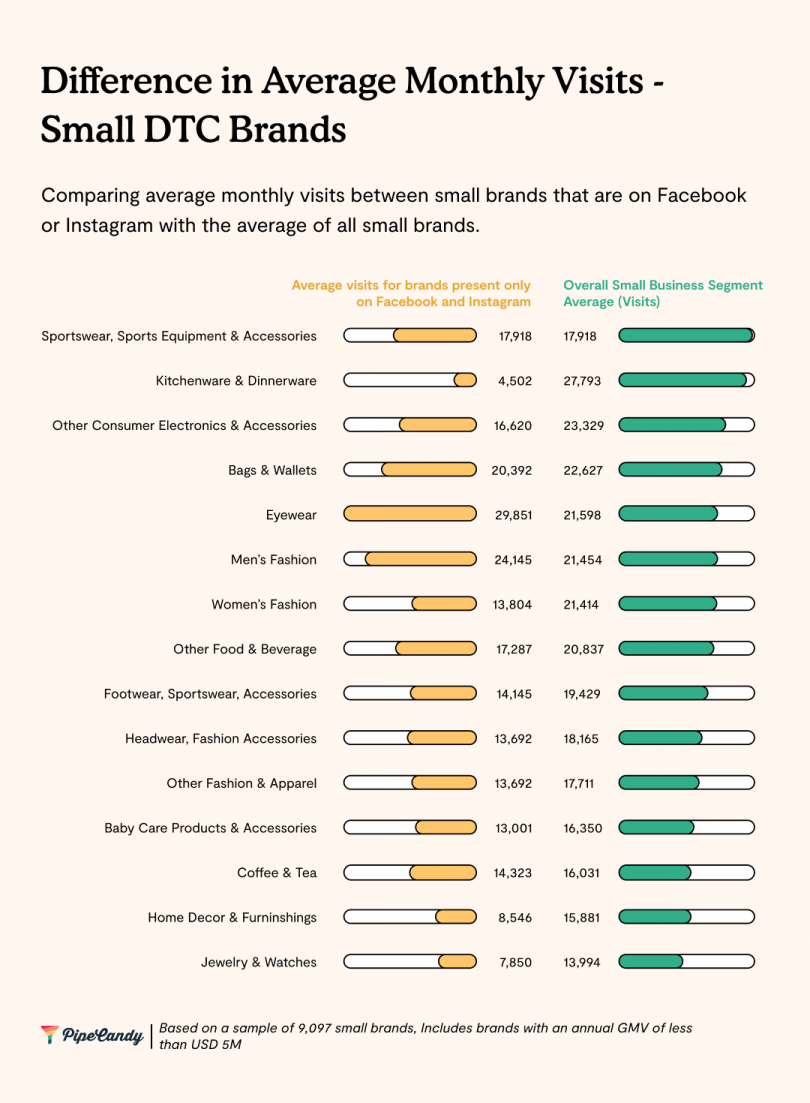
In the Small and Mid-Market segments, Google Ad budgets for brands exclusively present on Facebook and Instagram are three times lower than the overall segment average.

The gap is most pronounced in Women’s Fashion, Home Decor and Furnishings, Eyewear, and Jewelry & Watches categories. The first two have a large number of SKUs and consequently, a very high volume of paid clicks each month compared to the rest of the categories.

According to PipeCandy's data, the average daily Google Ads budgets across the small and mid-market segments was three times the average of brands that were present only on Facebook and Instagram. The difference in the number of visitors, however, isn’t proportional to this. Average monthly visits across small and mid-market segments is only 1.5 times more than brands that are present only on Instagram and Facebook.

It's worth investigating whether a concentrated presence on the top two social channels reduces the dependence on advertising on Google and hence the reduced budgets for advertising on Google, especially for brands exclusive to Facebook and Instagram.
To conclude this, we might need to compare expenditures on the Facebook Ad Network. However, a comparison of ad spend across channels isn't within the scope of this report.

Ecommerce Technologies
About 23% of all ecommerce businesses and 57% of DTC brands in the US are powered by Shopify. WooCommerce is the second most popular ecommerce platform technology, followed by Shopify’s enterprise version, Shopify Plus. While Shopify is a hosted solution, WooCommerce is an open-source ecommerce platform built on WordPress.

Shopify vs WooCommerce
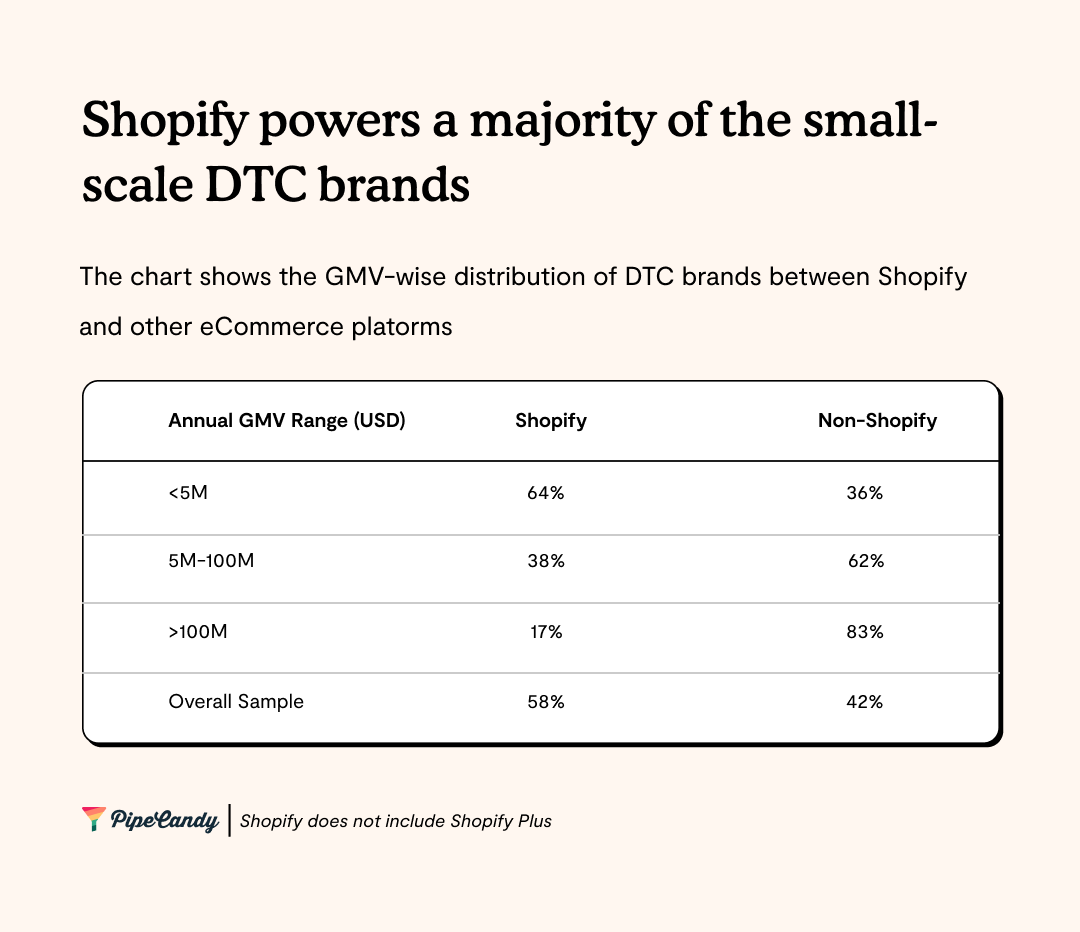
PipeCandy's data suggests that brands with less than USD 5M in Gross Merchandise Value (GMV) typically use WooCommerce. WooCommerce hosts a larger proportion of brands with less than USD 5M in GMV compared to Shopify - 88.26% for WooCommerce vs 84.51% for Shopify.

Shopify is primarily used by DTC brands with annual GMV less than USD 5M. As the GMV rises, the adoption shifts
According to data from PipeCandy, it appears that Shopify-affiliated brands invest considerably less in Google Ads compared to those unaffiliated with Shopify. The discrepancy in allocated budgets is most prominent among brands bringing in less than 5 million dollars in Gross Merchandise Value (GMV).
There is a stark contrast when it comes to Instagram presence as well. 96% of Shopify-associated brands maintain an Instagram account, in contrast to the 86% observed among non-Shopify brands. Furthermore, exclusively maintaining a presence on Facebook or Instagram is seen in a quarter of Shopify brands, whilst this only holds true for 18% of non-Shopify brands.

Increasing costs associated with shipping and advertising could compel numerous Direct-To-Consumer (DTC) brands to compromise their profit margins to Amazon in return for reliable demand at a consistent cost, potentially presenting a challenge to the DTC ecosystems.
In the preceding two years, the number of apps on Shopify’s App Store has more than doubled, and a revision in the revenue-sharing model now allows developers to retain the entire amount (previously only 80%) of the first $1M they earn on the platform. By creating apps for Shopify, developers accrued more than $230M in 2020. This new model may offer improved incentives for developers to create more high-quality apps for small DTC vendors. Shopify has also integrated multiple products into the ecosystem, beginning with its payment processing system and several acquisitions to facilitate 'Buy Now Pay Later' (BNPL) options and other emerging payment methods. In essence, Shopify is poised to shift its battle focus from storefronts to order fulfilment and payments.
Source Article: Here