
Overview of the Direct-to-Consumer (DTC) Sector – 2022
You are reading Part 1 of a series of 2 parts.
Pioneering digital brands such as Bonobos, Warby Parker, and Casper played instrumental roles in propelling the 'Direct to Consumer' business approach to prominence. By leveraging social media, websites, and apps, they elevated consumer engagement and managed the customer experience. They also seized control of their product, marketing, and customer acquisition expenses by eliminating intermediaries. Consequently, DTC has continuously been refined, transformed, and improved, transforming into both a business model and a distribution strategy.
DTC is no longer confined to digital-first or digital-native brands. Over the past five years (2016-2021), at least 15 DTC companies have become public entities, with some even establishing physical stores by the time of their initial public offering (IPO). Whilst these companies maintain substantial direct online sales, they've expanded beyond the digital sphere, offering products on platforms like Amazon or Etsy, or via wholesale distribution.
The concept of DTC has broadened and no longer solely applies to brands that sell through their own direct online channel. Today, even small brands conduct business on Amazon while also maintaining a Shopify presence. Large retail-first companies such as Nike, Pepsi, and Apple also have their own online DTC platforms.
Four significant advancements have propelled the DTC revolution.
Firstly, the expansion of the Shopify ecosystem has allowed emerging brands to establish eCommerce sites effortlessly, thus facilitating both their branding efforts and online store operations. In essence, Shopify provides solutions to any challenging issues a brand might encounter, including technology, logistics, payments, and banking.
Secondly, the rise of Facebook and its social media network provided small brands with a platform to expand their digital marketing and consumer engagement, without the need for intermediaries. Although Facebook has tightened its pay-to-play reach, this has led to increased customer acquisition costs. Nonetheless, its influence on the early growth of DTC businesses is undeniable.
The often-overlooked third advancement is the shipping and fulfillment ecosystem. The advancement of fulfillment services such as free shipping, same-day delivery, and free returns has significantly impacted how DTC brands operate.
Lastly, the liberal credit liquidity in the market has played a crucial role. Brands now have access to venture capital and off-balance sheet financing to spur growth. At the same time, online consumer financing options, such as 'Buy-Now-Pay-Later', have expedited consumer adoption of brands.
This report delves into the current landscape of the DTC industry, offering data-driven research insights on DTC product categories, social media presence, advertising expenditures, eCommerce technology, shipping maturity, and the shift towards physical retail. It doesn't offer a prescribed DTC strategy, if such a thing exists!
The research uses a sample of 21,700 DTC businesses in the US, drawn from PipeCandy's proprietary global eCommerce and DTC database.
While the term DTC does include businesses offering digital multimedia content, this report focuses solely on DTC brands selling physical goods. The report categorises DTC brands as follows:
1. Digitally Native Vertical Brands (DNVB), online-born brands selling and shipping their own products, and actively promoting through their own digital and social media platforms.
2. Brands with a considerable percentage of sales derived from their own online channel, but also selling through other channels.
3. Brands using DTC as a channel strategy, typically traditional brick-and-mortar brands that have recently added online direct selling to their channel mix.
4. Reborn DTC brands, traditional physical retailers that have adopted DTC as a key channel, increasingly becoming digital-first.
State of the Direct-to-Consumer Industry - 2022:
Summary of Key Points
COVID-19 rapidly accelerated the eCommerce industry's progress. As consumers adapted to staying at home, DTC became a familiar term. Even older demographic groups started exploring new brands and making online purchases.
Despite supply chain hurdles and soaring digital media costs, 2020 and 2021 were pivotal years for DTC. These years saw several initial public offerings, valuation recalibrations, and impressive growth figures for numerous DTC brands, spurred by their community-building efforts and financial innovations like 'Buy-now-pay-later'.
Estimations suggest there are approximately 110,000-120,000 DTC businesses in the United States, making up about 13% of the country's 800,000 eCommerce websites selling physical goods.
Compared to the 95% of all eCommerce businesses in the US with a gross merchandise value under USD 1M, over 70% of DTC eCommerce businesses in the US have a GMV between USD 1M and USD 5M. The largest categories of DTC brands in the US today are Fashion and Apparel, Home and Garden, and Food and Beverage, comprising over 75% of the market.
The Fashion and Apparel category predominantly consists of businesses specialising in jewellery, watches, fashion accessories, and footwear.
Around 25% of all DTC businesses offer next-day and two-day delivery, with this figure rising to 30% for mid-market brands. A significant portion (28%) of smaller (less than USD 1M in GMV) DTC businesses offer same-day delivery.
The United States Postal Service remains the primary logistical support for small to mid-market businesses, with about 70% of businesses with revenues under USD 5M depending on the federal mail service for parcel delivery. UPS and Fedex meanwhile have more significant reach among larger enterprises.
Over 60% of the analysed DTC companies did not utilise Google Ads in the last 12 months. Of the businesses that did use Google Ads, more than 80% spent less than USD 5,000 per month. Enterprise eCommerce brands with physical retail stores reported higher Google Ad spends, with their average monthly spend approximately 1.8 times that of large digital native brands. In contrast, over 90% of DTC brands maintain a presence on Facebook, Instagram, and other social media channels.
DTC businesses have recognised the value of having their products in physical stores, enhancing brand reputation and driving more visitors to their direct online channels. PipeCandy estimates suggest that about 47% of small and mid-market DTC businesses have some product presence in physical stores. In certain categories, such as Men's or Women's Fashion, DTC brands with physical store channels attract almost four times as many visitors to their websites as digital-only brands.
A Synopsis of the Direct-to-Consumer (DTC) Sector in the US
Redefining DTC
In their infancy, DTC brands, being digital natives, set themselves apart from traditional retailers by directly engaging customers through their unique digital channels. This was used for articulating their brand ethos, cultivating a faithful audience, or for conducting sales and services. They tapped into the wealth of customer behaviour data to shape product strategies and personalise communication. These DTC brands, bolstered by ample venture capital, flourished amidst scant competition and cost-effective advertising on social media platforms.
However, as competition tightened and customer acquisition costs (CAC) soared, these digital natives faced growth constraints due to their 'online-only' strategy. This compelled them to explore additional growth channels. For instance, Warby Parker, a trailblazer in the DTC model, witnessed a 49% surge in average CAC in 2020, with its advertising spend per customer amounting to 19% of the average customer revenue. Similarly, Allbirds, another leading DTC brand, experienced a slump in new customer share from 59% to 47%. To maintain their growth trajectory, these brands branched out into online marketplaces and retail websites.
Although these online marketplaces facilitated product discovery and quick sales growth, it meant that DTC brands lost full access to customer data they were traditionally privy to. The choice of marketplaces resulted from a balancing act between customer data and expediting customer reach and revenue growth.
Physical stores started appearing in the DTC landscape, offering advantages such as better comprehension of customer intent, increased brand awareness, and trust building. Concurrently, brands dependent on wholesale, like prominent consumer packaged goods (CPG) brands, started establishing their own DTC channels to boost customer engagement and access consumer behaviour data.
It's becoming evident that the boundary distinguishing a digital native brand and brands utilising direct channels is becoming less defined.
Our team at PipeCandy proposes that the initial definition of DTC has now become outdated, and it would be more appropriate to characterise a DTC business as one that:
Trades physical items or offers digital multimedia content online, such as games, video, or streaming services.
Manages a functional e-commerce website for direct sales, independent of other sales channels it utilises.
Markets products under its own brand name.
Given this, the estimated number of DTC brands in the US could range from 110,000 to 120,000.
The Value of Goods Sold by DTC Brands in the US
The Gross Merchandise Value (GMV) denotes the total internet sales yielded on the websites owned by the DTC brands themselves. It doesn't account for sales happening via other routes such as online marketplaces, mobile apps, other retailers, and their own brick-and-mortar shops.
At PipeCandy, we categorise small DTC brands as those generating less than USD 5M in annual GMV, mid-tier DTC brands as those achieving GMV between USD 5M and USD 100M, and enterprise-level DTC brands as those exceeding USD 100M in GMV.
Most DTC brands in the US (around 71%) have a GMV falling between USD 1M and USD 5M.

Nevertheless, not every firm with less than USD 5M in online sales is a small business. There are renowned consumer packaged goods (CPG) brands with robust sales in other channels like retailers and online marketplaces, but their direct-to-consumer (DTC) online channel might be relatively new and only moderately successful. One effective way to recognise these larger firms with low gross merchandise value (GMV) is by contrasting their online sales with their internet traffic. Many such firms experience high levels of visitor traffic, but lower conversion rates, resulting in a lower GMV.
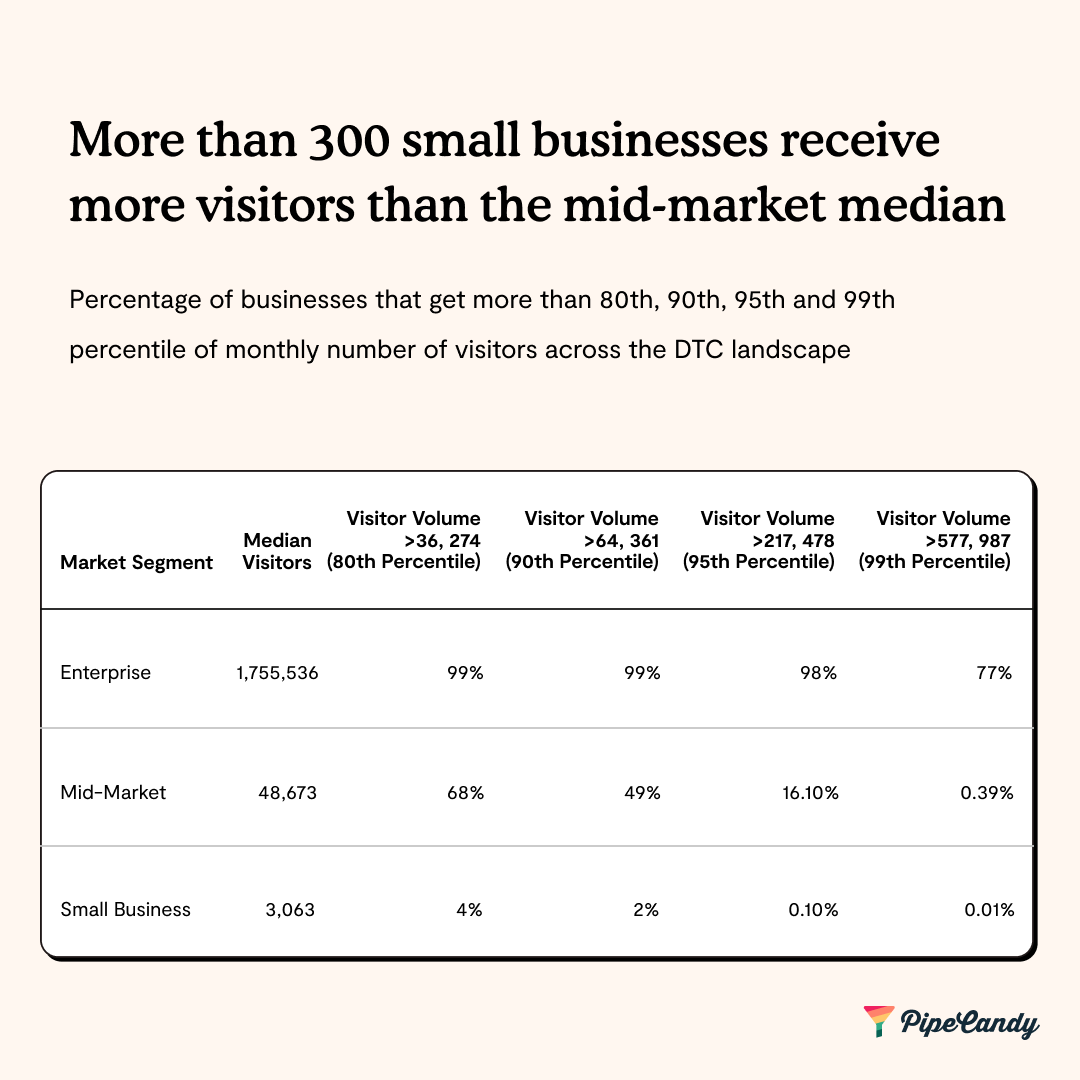
While there is often a close relationship between monthly website visits and visitor numbers, there are a few brands that buck the trend. These are brands that draw significant traffic to their e-commerce sites but don't generate equivalent gross online sales.

There are 330 small-to-medium businesses (SMBs) that attract more visitors than their mid-market counterparts, and it would be interesting to understand why they can attract such high visitor numbers while their GMV remains low.
Several reasons could potentially explain this:
The brand might be a recent entrant to the market, and as such, not yet familiar to consumers. Its website might not have built up enough trust to motivate purchases. In such situations, website traffic is often driven by paid acquisition efforts.
The brand could be well-established, but its products are also accessible on other channels, sometimes at discounted prices. This includes third-party platforms where customers may visit the brand's website for product research or price checks but choose to purchase from these other channels.
Lastly, the brand might be well-known, but their e-commerce conversion funnel could be poorly structured.
Product Categories
Presently, more than 75% of direct-to-consumer (DTC) brands in the US fall into one of three categories: Fashion and Apparel, Home and Garden, and Food and Beverage. The Fashion and Apparel category is diverse, comprising Women’s Fashion, Men’s Fashion, Jewellery and Watches, Headwear, Footwear, Eyewear, Bags and Wallets, among other sub-categories.

Out of the top three, Fashion and Apparel dominate in terms of the number of brands it encompasses.
Adaptability is key in the fashion sector. It's vital to stay abreast of consumer desires, feedback and local trends to remain relevant. Brands that maintain a close connection with their customers can more swiftly respond to changing expectations and differentiate themselves from rivals. Community-centred DTC brands are particularly successful in curbing instances of counterfeit products.
The rise of fashion resale exemplifies how an industry niche can be identified and developed through closer customer engagement, a comprehensive understanding of the customer journey, and data accessibility.
Within the Fashion and Apparel realm, a large number of businesses focus on selling items like jewellery, watches, fashion accessories, and footwear. Apart from these specialised DTC subcategories, the top section within fashion is labelled 'Miscellaneous'. This comprises brands offering products across multiple subcategories and those selling beauty and personal care products, fragrances, hair care items, and niche clothing.
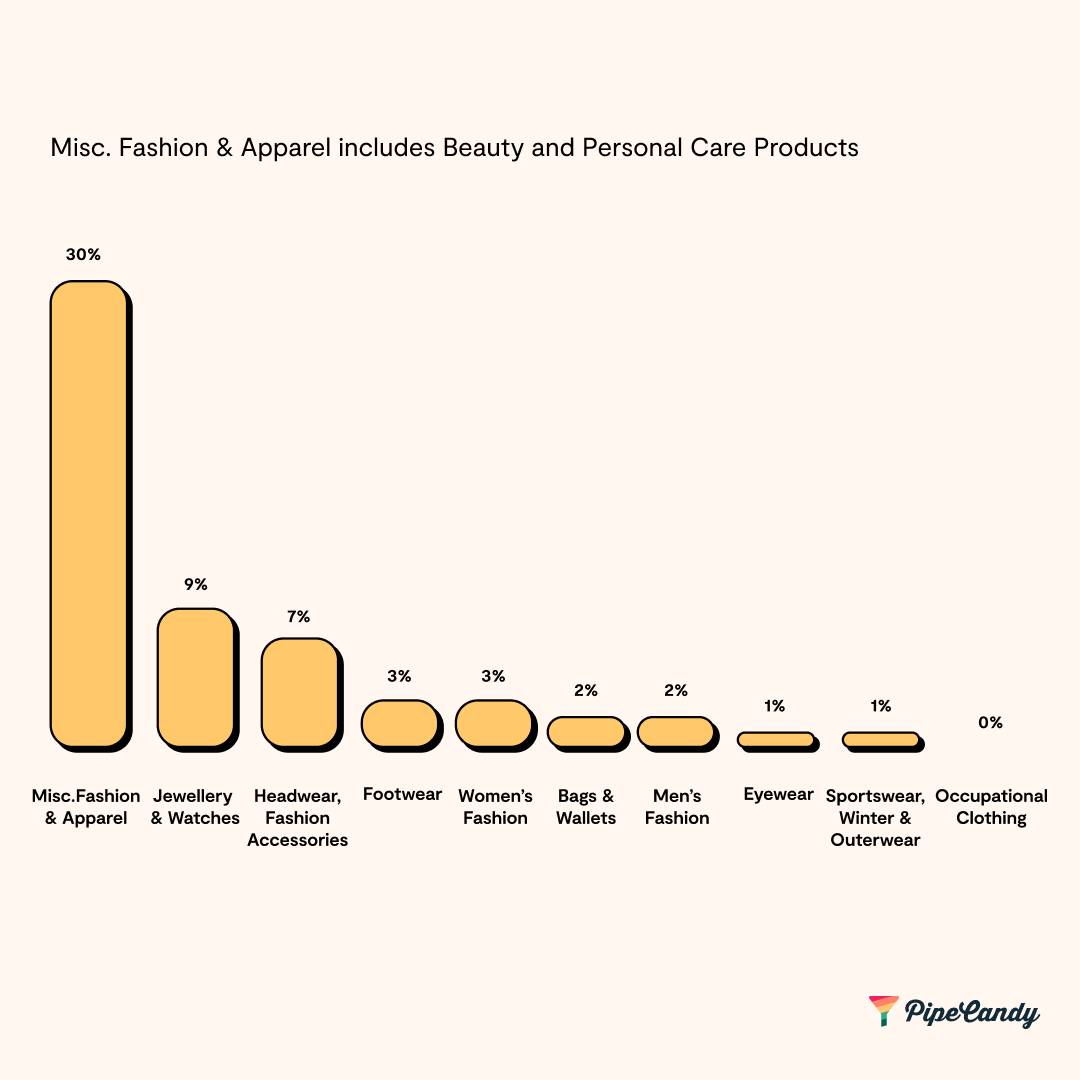
Jewellery and Watches stand as the second-largest subcategory. DTC jewellery brands have managed to bridge the industry gap between exorbitantly priced brands and unbranded jewellery - the former typically costs six times more than the latter. These DTC jewellery brands embody the essence of the DTC model, offering a high level of personalisation and appealing price points.
Source Article: Here